Cookie
FlexiHub Team uses cookies to personalize your experience on our website. By continuing to use this site, you agree to our cookie policy. Click here to learn more.
USB Redirector

Developer Tools for iOS Debugging

iOS debugging tools are essential when developing applications for the system. It’s almost impossible to create a bug-free app without testing. While testing, you will need these tools to track down the source of any issues you encounter. Issues with the app will not only impact the user experience but they also violate App Store’s guidelines, making it much harder to publish.

Olga Weis Olga Weis Last updated Dec 26, 2023

Debug tools fulfill various roles, and even within the same category, different tools may have their own individual workflow. Here, you can learn about some of the best mobile app debugging software options.

FAQ about debugging iOS

The primary iOS debugging tool is LLDB, which is integrated into Xcode. There is a wide variety of other debugging tools.
You need to run the application in Xcode, setting up breakpoints in places that may have contributed to the bug. Then you have to analyze the information you get from those breakpoints and remove the bug from the code. UI and other types of debugging have a similar process, it’s all about testing and acting on the results.
Yes, Xcode can debug devices that are connected to the Mac with a USB cable.

Choosing the Right Debugging Tool

Your choice of debugging tools will depend on your workflow and your budget. It’s also worth remembering that these are not mutually exclusive choices - in fact, having a variety of debugging software can be necessary. Here are some tips:

- Check if the app integrates well with your productivity and development tools. Is the benefit worth having to juggle incompatible software?

- Consider the skills that the debugger requires. Will your developers need time to learn them, and how much?

- See if the basic, integrated tools already cover your needs.

- And finally, when using paid solutions, consider the possibility that your production will expand. You would have to change to a more expensive plan or restructure the process.

Overview of iOS Debugging Tools

Native Tools

Xcode

As Apple’s official development environment, Xcode includes a complete, but moderate kit of features to debug an application for iOS. These include a complete simulator, breakpoints, and even a mode that highlights slower UI elements during runtime. It’s also capable of iPhone USB debugging.

★ Features

In Xcode, breakpoints can be customized to execute a specific action when reaching them or to add specific conditions. You can see the called methods in the Navigator and see the class contents with Quick Look. This debug tool is also equipped with some UI optimization instruments, such as the Color Blended Layers and an Interface Hierarchy browser.

★ Use Cases

Xcode sets the development and testing baseline, and many other apps only modify it and provide additional functionality. Debugging is not the main focus, not that it should be in a standard integrated suite.

LLDB (Low-Level Debugger)

LLDB is the default debugger in Xcode. The debugging features in Xcode are all based on it, even if they’re accessed in the GUI. When the breakpoint system proves insufficient, it may be time to move on to issuing direct LLDB commands in the terminal.

★ Features

By using LLDB, you can attach to processes, create variable watchpoints, examine variables, backtrace threads, and much more. With the use of arguments, it can do pretty specific things, such as waiting for a process to launch before attaching. LLDB can be used for USB debugging iPhone tasks, or it can be applied to a simulator instance.

★ Use Cases

LLDB is a lot more complete than the options available from Xcode’s interface, and not particularly hard to learn. True to its name, it’s the only native option to find low-level issues that can’t be obviously found in your code.

Instruments

Another part of Xcode, Instruments is focused purely on data collection and statistics. And the bulk of this data will be about resource use. Instruments tracks the use of CPU power, battery charge, RAM, and such.

★ Features

Instruments doesn’t just collect data, but it also allows you to filter and display it for maximum convenience. The gathered information is summarized visually on a timeline, with a graph for each tracked stat. When you find a suspect place on one of the graphs, you can view the selection in detail.

★ Use Cases

Using Instruments is a good first step to optimizing your app’s performance. Memory leaks and processor overuse are every bit as important to target as errors and crashes. And often, they can only be found statistically.

Simulator

The Simulator is included as a part of Xcode, and you can download an iOS runtime to run your apps in a virtual environment, without the need for an additional device. It can be useful for simple hands-on testing or bug hunting.

★ Features

The simulator can be interacted with through simple controls, and it can receive data from the user’s system. This application aims to be as authentic as possible, so it provides options for hard-to-simulate situations, such as falls, location changes, and Face ID.

★ Use Cases

While it’s an immensely, obviously useful tool, it’s also important to recognize the differences between a real device and a simulator instance. The main differences that Apple documentation warns about have to do with hardware, so don’t use it as a benchmark.

Related Articles

Third-party Tools

FlexiHub

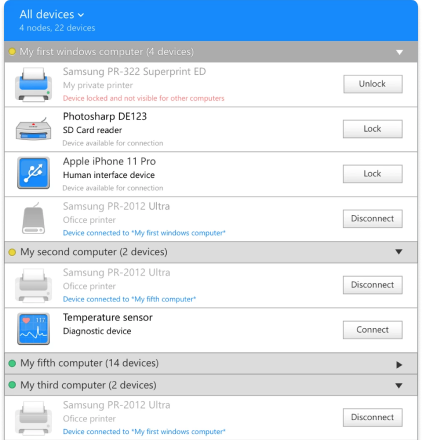
FlexiHub virtualizes USB devices that are attached to a computer and makes them accessible from a different computer over the network. The range of devices includes iPhones and iPads. This has some novel and impressive uses in the field of app development, including Xcode remote debugging.

★ Features

An attached device will be shared with other FlexiHub users on the same network through an encrypted connection, ensuring data safety. The device can be password-protected or temporarily locked to prevent its use. Importantly, FlexiHub is completely cross-platform, so a Windows or Linux computer can act as the server for iOS devices, while a developer uses them on a macOS machine.

IOS Remote Debugging
30-day demo period

★ Use Cases

FlexiHub allows remote development teams to have a centralized base of devices to tap into and test their iOS software. This provides a more realistic alternative to the built-in simulator, without actually creating the need for developers to get and maintain their own hardware.

We have also made a brief video to demonstrate a hands-on experience of connecting iOS devices to Mac for remote debugging:

Note: For best performance with iOS devices, it is recommended to use a direct connection in FlexiHub, which involves machines with the public IP addresses on both sides. If the iOS device is connected over WAN for remote debugging, for latency decrease it is essential to deploy a tunnel server.

Reveal

Reveal by Itty Bitty Apps is, in lots of ways, similar to Xcode’s Debug View Hierarchy. One major difference is that it needs to be linked with an app in order to analyze it. And yet, it’s still worth using. Let’s explore the reasons why.

★ Features

Much care has been poured into Reveal’s interface, making it easier to find the needed UI elements. Once you do, their attributes can actually be changed on the fly. Layout problems are detected and highlighted automatically.

★ Use Cases

Reveal can be a simple improvement to the workflow, thanks to its interface. It can help with a thorough look into an unfamiliar project. And, of course, the quick adjustment of element dimensions and other values is a way to experiment with the interface.

Charles

Charles is a network monitoring tool that keeps track of requests and responses. Once again, this is a role that is also fulfilled by the built-in Instruments. Charles isn’t just an alternative, though; when it comes to HTTP and SSL debugging, it does a lot more.

★ Features

This debugging tool can actually send its own requests to the tested app. They can be automatically re-sent to quickly see how modifications affect the network behavior of the app. Charles can be set up in the middle of an SSL connection, providing highly useful data that is otherwise locked.

★ Use Cases

Developers of any internet application, especially a secure one, can get a lot of use out of Charles. As long as they know how to interpret the output, they will be able to detect HTTP and SSL connectivity issues.

Bugfender

Bugfender is a solution that sends error reports and logs in general from devices to a cloud service, as a form of iOS remote debugging. It’s not really intended for use on a single device, but rather as a way to gather data relevant to debugging from users. They turn into testers, in a way. The app has to be ready to ship, though - it’s not for early development stages.

★ Features

In addition to simple crash logs, Bugfender tracks app performance, and records everything that could indicate the cause of the error. Crash data can be congregated into a graph that’s helpful if you want to see which devices cause the most trouble. Bugfender provides its own SDK to integrate these functions into apps.

★ Use Cases

While it may seem like Bugfender is only catered to large commercial users, it actually has a free plan for independent developers. This is an opportunity for small or one-person companies to implement debugging practices on par with those used by major companies.

Crashlytics

Crashlytics is also a reporting tool, and it’s a part of Google Firebase, but the rest of the platform doesn’t need to be used. The tool is inserted into apps through the use of an SDK. Crashlytics is free and unlimited.

★ Features

The features of Crashalytics generally revolve around data crunching and convenience. Once again, you’ll see report graphs and general statistics. This debugging tool is friendly to popular project management tools, such as Jira.

★ Use Cases

If you heavily use Firebase in your development process, Crashlytics is a no-brainer, but it also has plenty of merits to justify using this tool by itself. Take note that it only gets data connected to crashes. You won’t be able to detect performance issues or non-fatal bugs this way.

Raygun

Raygun is a crash reporting and user monitoring tool. It collects information both about fatal errors and performance. Data can be gathered broadly, and then the findings can be used to narrow down the range of tracked devices and get more metrics from them.

★ Features

Raygun borrows a lot of its tools from the realm of web UX. The metrics are related to app loading times, whether it’s a particular element or in general. As for the error reports, they are condensed into viewable graphics, and allow the developer to search their detailed information for the root cause.

★ Use Cases

With a steep starting price of $40/month, Raygun is aimed at small businesses that can afford the cost, and advanced features require a more expensive plan. It has the same use as any other error and performance-tracking app - providing developers with a lead that they can work on.

Conclusion

As you can see, many aspects of iOS apps benefit from debugging, if not outright require it. The code itself, the UI, resources, and even network activity - depending on the functionality of your app, you may need them all. And the debugging workflow can also benefit from tools like FlexiHub, that make it easier to provide testing resources by enabling developers to remote debug iOS devices.

Flexihub for remote debugging
  • 4.8 overall rank based on 386+ Reviews
  • Requirements: Windows, macOS, Linux, Android and Raspberry Pi.
  • 10.45MB Size.
  • Version 6.1.15025. (19 Feb, 2024).
  • Pricing starts $14 per month billed annually